Real Time Data and Forecasting (RTDF) Report

Taste and Odor State Water Project
Estimating Salinity Constituent Concentrations
30-year Retrospective Overview of MWQI Program
This site is supported by the State Water Contractors. It is based primarily on data from the California Department of Water Resources (DWR) Municipal Water Quality Investigations (MWQI) as part of the Real Time Data and Forecasting (RTDF) project. Its goal is to bring real time, near real time, and forecasted water quality data to source water managers, treatment plant operators, scientists, and other stakeholders. Data from numerous sources are assembled and presented with the goal of providing a concise, single source of relevant information. Data are presented in tables and graphs in combinations that are specific to particular concerns.
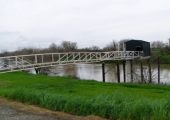
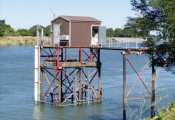
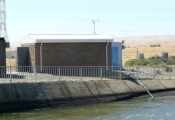
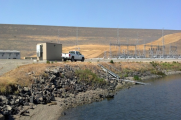
RTDF field data is the primary source of data and originates from 46 real-time field sensors at 5 MWQI stations measuring key water quality constituents, with organic carbon and bromide the primary focus. Of the 46 sensors, 31 are operated by MWQI and the other 15 by DWR's Division of Operations and Maintenance, DWR's Environmental Water Quality and Estuarine Studies Branch, the US Geological Survey, and the San Luis Delta Mendota Water Authority. Information provided by the the real-time stations is supplemented with other, selected water quality and hydrology data reported to CDEC by other agencies with links provided to specific websites that contain pertinent information.
Operations data, available on the daily dispatcher's report from DWR operations, provide daily pumping and generation flows and daily storage for selected projects. Electroconductivity (EC) forecasts at key delta export locations are provided by DWR's operations modeling group and include observed values for comparison; observed values are provided through CDEC. Daily EC, bromide and dissolved organic carbon (DOC) forecasts are also provided by DWR's operations modeling group for stations along the California Aqueduct and its principal branches.
Submit comments or questions here.
Summary Table (updated daily)
Mean daily values and seven day averages. Values less than the instrument reporting limit are annotated as (<RL). All Data are preliminary.
| 5/17/2026 | 5/23/2026 | % Change | 7-day Average | ||
| Sacramento River (Hood) | |||||
| Mean Daily Flow, cfs | 11,185 | 7,612 | -32 | 9,462 | |
| Salinity (EC), µS/cm | 140 | 143 | +3 | 151 | |
| DOC, mg/L (Calculated) | 2.14 | 2.04 | -5 | 2.19 | |
| TOC, mg/L (Calculated) | 2.21 | 2.09 | -6 | 2.26 | |
| San Joaquin River (Vernalis) | |||||
| Mean Daily Flow, cfs | m | 2,174 | --- | 2,236 | |
| Salinity (EC), µS/cm | 278 | 247 | -11 | 239 | |
| DOC, mg/L | 2.67 | 2.32 | -13 | 2.47 | |
| TOC, mg/L | 2.71 | 2.41 | -11 | 2.53 | |
| Bromide, mg/L | m | m | --- | 0.07 | |
| H.O. Banks Pumping Plant (SWP) | |||||
| Mean Daily Pumping, cfs | 461 | 461 | <1 | 526 | |
| Salinity (EC), µS/cm | 361 | 360 | <1 | 360 | |
| DOC, mg/L | 3.67 | 3.68 | <1 | 3.70 | |
| TOC, mg/L | 3.91 | 4.00 | +2 | 3.93 | |
| Bromide, mg/L | 0.12 | 0.12 | -2 | 0.12 | |
| Turbidity, NTU | 2.63 | 2.24 | -15 | 3.19 | |
| C.W. Jones Pumping Plant (DMC) | |||||
| Mean Daily Pumping, cfs | 3,432 | 902 | -74 | 3,008 | |
| Old River Flow, cfs | 729 | 613 | -16 | 596 | |
| Salinity (EC), µS/cm | 356 | 287 | -19 | 308 | |
| DOC, mg/L | 3.26 | 2.96 | -9 | 3.62 | |
| TOC, mg/L | 3.38 | 3.06 | -10 | 3.71 | |
| Bromide, mg/L | 0.14 | 0.09 | -38 | 0.10 | |
| Dissolved Oxygen, mg/L | 7.67 | 7.81 | +2 | 7.97 | |
| Turbidity, NTU | 11 | 3 | -75 | 8 | |
| Chloride, mg/L | 44 | 34 | -22 | 37 | |
| Nitrate, mg/L | 1.93 | 1.69 | -13 | 1.47 | |
| Sulfate, mg/L | 31 | 25 | -19 | 26 | |
| pH | 7.75 | 7.60 | -2 | 7.73 | |
| Temp, C | 22 | 22 | <1 | 22 | |
| Gianelli Pumping Plant (SWP) | |||||
| Mean Daily Pumping, cfs | 0 | 0 | <1 | 302 | |
| Mean Daily Generation, cfs | 977 | 5,165 | +429 | 2,856 | |
| Salinity (EC), µS/cm | 425 | 426 | <1 | 425 | |
| DOC, mg/L | 3.00 | 3.05 | +2 | 3.05 | |
| TOC, mg/L | 3.01 | 3.11 | +4 | 3.07 | |
| Bromide, mg/L | 0.20 | 0.20 | <1 | 0.20 | |
| Dissolved Oxygen, mg/L | 7.50 | 6.56 | -13 | 7.09 | |
| Turbidity, NTU | 1.30 | 1.19 | -8 | 1.20 | |
| Nitrate, mg/L | 2.39 | 2.32 | -3 | 2.23 | |
| Chloride, mg/L | 74 | 74 | <1 | 74 | |
| Sulfate, mg/L | 35 | 35 | <1 | 35 | |
| pH | 7.61 | 7.46 | -2 | 7.54 | |
| Temp, C | 14 | 15 | +3 | 15 | |
| Barker Slough Pumping Plant | |||||
| Mean Daily Pumping, cfs | 79 | 86 | +8 | 80 | |
| Salinity (EC), µS/cm | 377 | 508 | +35 | 447 | |
| Turbidity, NTU | 11 | 10 | -12 | 10 | |
| Victoria Canal Near Byron | |||||
| Salinity (EC), µS/cm | 297 | 273 | -8 | 284 | |
| California Aqueduct TDS (est. from EC) | |||||
| Banks, mg/L | 195 | 192 | -1 | 197 | |
| Check 41, mg/L | m | m | --- | --- | |
| Check 66, mg/L | 216 | 215 | <1 | 219 | |
| Delta Total Outflow | |||||
| Outflow, cfs | 8,077 | 6,386 | -21 | 6,349 | |
| Devils Canyon Afterbay | |||||
| Salinity (EC), µS/cm | 358 | 355 | <1 | 356 | |
| Turbidity, NTU | m | m | --- | --- | |